

If you are at all like me, End-Tidal CO2 (ETCO2) was an oft-forgotten vital sign hanging out on the monitor. Like Ringo in The Beatles, it was the vital sign that I would notice was there, but would take a back seat to the more exciting vital signs like blood pressure (John Lennon), the pulse oximetry (George Harrison), and the heart rate (Paul McCartney). I’m NOT saying that the heart rate, blood pressure, and pulse oximetry aren’t important (they are), but ETCO2, like Ringo, is so much more. It can give you an idea of metabolic demand, the ventilation status during procedural sedation, and even help guide cardiac arrest resuscitation!
In this first of a two-part PEM 4 PEM post, we will take a more in-depth look at the basics of the ETCO2 number and waveform, develop an approach to interpretation, and practice assessing the ETCO2 in hypothetical patient care scenarios.
The Basics
As providers commonly use the term, end-tidal CO2 is a non-invasive measure, either quantitatively or qualitatively, of the partial pressure of CO2 in the air exhaled by the patient. Although, by definition, ETCO2 is the partial pressure of CO2 measured at the END of the tidal volume breath.
Qualitative devices give a yes/no answer of if the sensor detects CO2 but provides no number or waveform.
Quantitative devices provide a number (capnometry) and a waveform (capnogram). To utilize ETCO2 to its full potential, providers need to have a firm understanding of what both of those results mean.
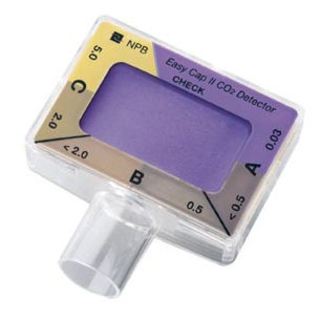
Qualitative ETCO2 Device
A colorimetric device that connects to the endotracheal tube to establish if there is CO2 and successful intubation.
If the color changes from purple to yellow, there is CO2 detected.
Remember
Gold is Good!
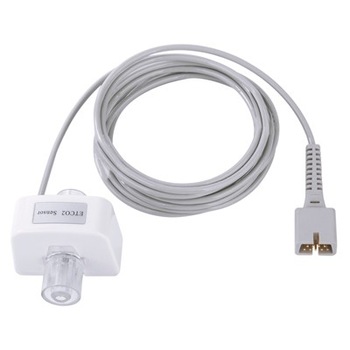
Quantitative ETCO2 Device
This device connects to the endotracheal tube and the vital sign monitor.
Remember
It provides capnometry AND capnography!
The Number
A wise PEM Doctor once told me that the ETCO2 number is ALWAYS accurate. It’s on the provider to determine what that number represents.
In an otherwise healthy patient, the value should be between 35-45 mmHg. Ideally, the numerical ETCO2 is a reflection of the partial pressure of CO2 (PaCO2) in the Arterial Blood Gas (ABG). However, due to the mixing of alveolar and anatomical dead space, the ABG PaCO2 will ALWAYS be higher than the ETCO2 by a minimum of 2-5mmHg in a healthy patient. To put it simply, the CO2 in the bloodstream is AT MINIMUM the ETCO2 number displayed on your capnometer. In kids with respiratory failure, it is often much higher!
The Waveform
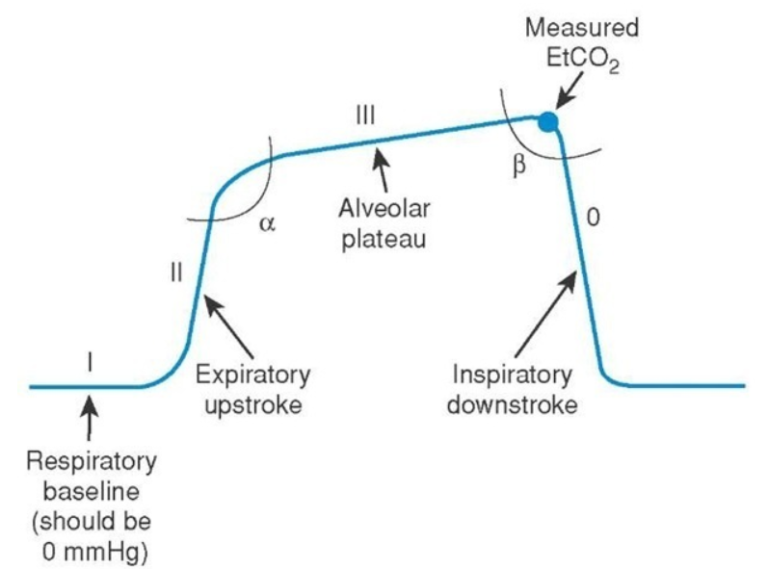
This is your classic 4 phased ETCO2 waveform.
Phase I: The baseline. This represents the end of inhalation and should be 0 as the ETCO2 sensor should not detect any CO2 during inhalation.
Phase II: The start of exhalation leads to a sharp upstroke due to the sudden increase in CO2 being exhaled. CO2 is traveling from the alveoli, through the anatomical dead space, and to the ETCO2 sensor.
Phase III: The ETCO2 senor is now receiving the high concentration of CO2 from the alveoli, as all the CO2 from the anatomical dead space has been exhaled. The number at the end of this phase is the measured End-Tidal CO2 and the number displayed on the capnometer.
Phase 0: This is the end of exhalation and the start of inhalation, causing a sharp decrease in CO2 reaching the sensor.
Alpha Angle: The transition zone representing mixed CO2 from the anatomical deadspace and alveoli to primarily the alveoli.
Beta Angle: The transition phase from exhalation to inhalation. The point prior to the drop is the ETCO2.
The Interpretation
There are four variables that factor into the value and waveform of the ETCO2.
CO2 Production
CO2 is produced at the tissue level and is an indicator of Metabolic Demand.
Pulmonary Perfusion
CO2 needs to reach the lungs to be exhaled to the ETCO2 sensor. Cardiac Output is the primary determining factor.
Alveolar Ventilation
Ventilation happening at the Level of the Lung will contribute to the waveform and capnometer value of the ETCO2.
Mechanical
Is there a Mechanical Issue with the ETCO2 monitor, sensor, or the tubing leading to the number and waveform.
The Approach
There are many different approaches and nearly all are great. The most important thing, just like interpreting an EKG or CXR, is that it is systematic. The approach I use is NEW STReets or NEWS RT.
N: Number
The first thing to look at is the number. Remember normal is 35-45. Is the number high? Low? Normal?
E: Expected
W: Waveform
The next 3 portions of the approach look at the waveform.
S: Shape
T: Trend
R: Rate
What is the frequency of the waves and are they regular or irregular? Hyperventilating patients should have more frequent waves and a lower ETCO2 number compared to the higher ETCO2 number and less frequent waves in hypoventilation.
Quiz Yourself
Below are some general situations. Think about the situation in terms of the 4 factors discussed above.
CO2 Production
Fever
Recent Sodium Bicarbonate Administration
Malignant Hyperthermia
Pain
Pulmonary Perfusion
Increased cardiac output
Elevated blood pressure
Alveolar Ventilation
Hypoventilation
Respiratory Insufficiency (ie seizures)
Respiratory Depression (ie opioids, head trauma)
Sedation
Bronchial intubation
Mechanical
Ventilator leak
Exhausted CO2 absorber
CO2 Production
Hypothermia
Diabetic Ketoacidosis (respiratory compensation)
Aspirin Overdose (respiratory compensation)
Metabolic Acidosis
Pulmonary Perfusion
Decreased cardiac output
Hypotension/Shock
Cardiac Arrest
Pulmonary Embolism
Sudden Hypovolemia
V/Q Mismatch
Alveolar Ventilation
Hyperventilation
Apnea
Severe airway obstruction
Sudden Extubation
Mechanical
Circuit disconnection
Next are more specific situations that can occur.
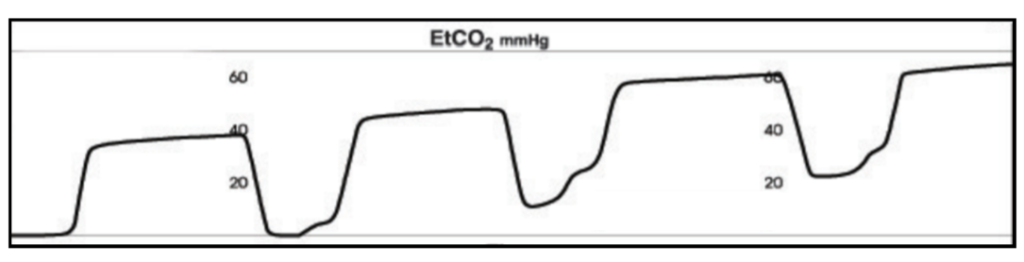
You have a patient with the following changes in the ETCO2
Kink in the endotracheal tube.
Not always an indication of a dislodged ETT if the patient is still breathing on their own. In the paralyzed patient, this would indicate an extubation.
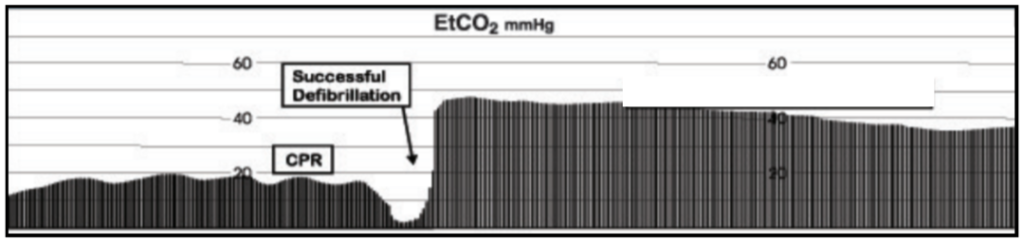
Loss of pulses/Cardiac arrest.
Esophageal intubation
Return of Spontaneous Circulation (see the image below)
Correction of ET Tube obstruction or kink
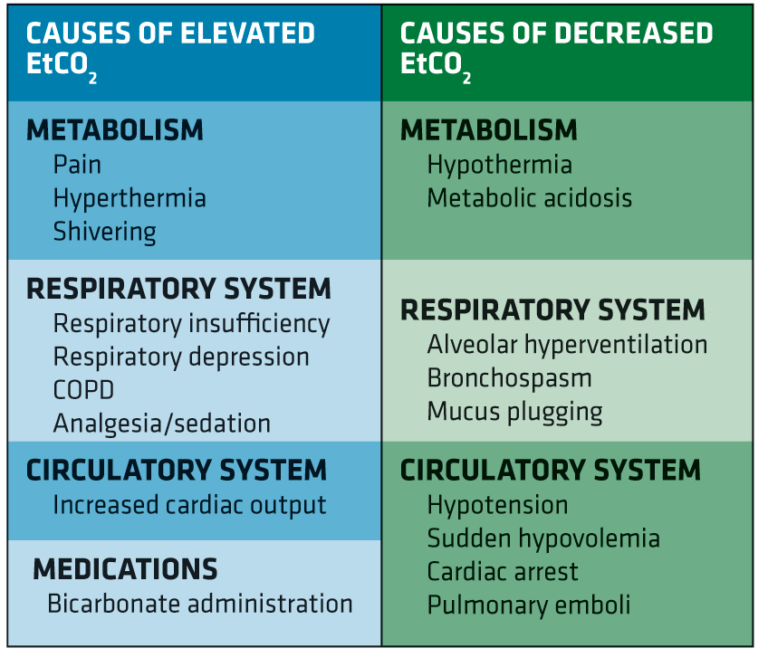
The table below is a quick reference created by EMS World on factors affecting the ETCO2
Below are more patient scenarios. Practice using NEW STReet (NEWS RT) to determine the possible causes of the capnogram and capnometer ETCO2 value.
Case 1:
14 year old patient has significant retractions including suprasternal and subcostal but normal mental status. Saturations 95%, ETCO2: 56 mmHg, RR of 20, and the ETCO2 has been like the image below for 5 minutes.
Number: The ETCO2 is 56 mmHg making it elevated. Remember normal is 35-45 mmHg. We can assume that the PCO2 is at least 56 and likely even higher!!
Expected: In a patient who is having increased work of breathing, an elevated CO2 from either increased production or decreased excretion is very possible
Waveform: This waveform is classically known as a “Sharkfin Pattern” and is a sign of obstruction.
Shape: As we mentioned above this is the “Sharkfin” waveform. Due to the obstruction, there is a loss of the plateau as CO2 is more slowly reaching the sensor from the obstructed alveoli.
Trend: It has been going on for 5 minutes and not changed so we can assume it is an accurate representation of the physiology.
Rate: The RR is 20 and for a 14 year old, that is fast. The ETCO2 would be lower if the patient was adequately compensating but that is not happening.
The most likely cause is bronchospasm from an asthma exacerbation. Another possibility is foreign body ingestion, especially in younger patients.
A bronchodilator trial might be useful in this scenario.
The cause could still be related to bronchospasm, however, a kinked or partially obstructed ETT would lead to a similar waveform.
Case 2:
18 month old patient has fevers, significant retractions, including suprasternal, subcostal, headbobbing and waning mental status. Saturations 90%, ETCO2: 50 mmHg, RR of 8, and the ETCO2 has been steadily increasing and the rate has been slowing for the past minute.
Number: The ETCO2 is 50 mmHg and is elevated. Remember normal is 35-45 mmHg. We can assume that the PCO2 is at least 50 mmHg and likely higher.
Expected: This patient has increased work of breathing, slowed respiratory rate, increased metabolic demand and a waning mental status. It would be expected that the PCO2 would be elevated in this patient.
Waveform: This waveform consistent with Hypoventilation or Increasing Metabolic Demand.
Shape: There continues to be a rectangular shape however, the size is increasing which is consistent with a rise in the ETCO2.
Trend: With the trend has been a gradual rise in the ETCO2 over the last minute.
Rate: The RR is 8 (very slow for an 18mo) and slowing over the past minute.
The possible causes of this are hypoventilation or increased metabolic demand. In this patient scenario, the child is showing signs of impending respiratory failure and will require, at minimum, ventilatory support with bag-mask ventilation and possibly intubation.
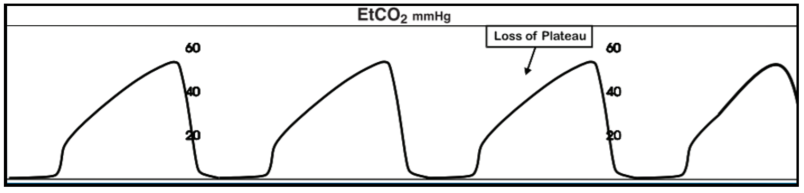
Case 3:
15 year old with a broken arm requiring sedation. During the sedation, he starts moaning and you see the below waveform. Saturations 99%, ETCO2: 35 mmHg, RR of 20, and the ETCO2 turned into this over the past 30 seconds.

Number: The ETCO2 is 35 mmHg which is in the low-end of normal (35-45 mmHg).
Expected: This is likely not sedated enough and I would expect him to have a lower ETCO2 with his increasing respiratory rate.
Waveform: This waveform consistent with Hyperventilation or Decreased Metabolic Demand.
Shape: There continues to be a rectangular shape however, the size is decreasing which is consistent with a drop in the ETCO2.
Trend: The trend has been a gradual decrease in the ETCO2 over the last minute.
Rate: The RR is 20 (fast) and suddenly increased during the sedation.
The possible causes of this are hyperventilation or decreased metabolic demand. In this scenario, the patient is likely undersedated and requires a pause in the reduction in order to receive more sedative medicine.
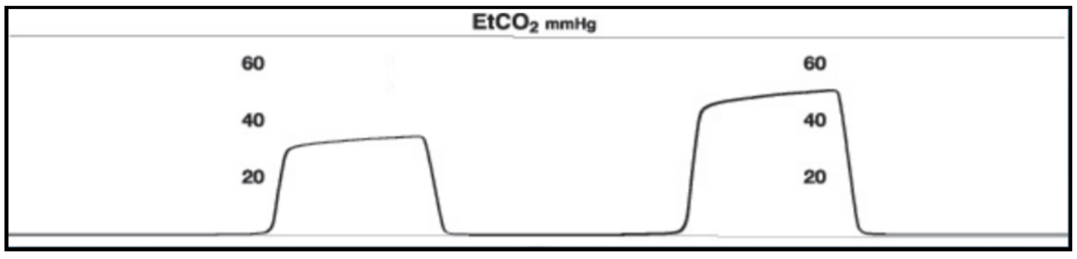
Case 4:
12 year old with a severe asthma exacerbation that was just intubated. Following intubation, you see this on the monitor. Saturations 98%, ETCO2: 70 mmHg, RR of 16, and the ETCO2 has been like this since the intubation.
Number: The ETCO2 is 70 mmHg which is in the extremely high and worrisome especially in an appropriately intubated patient.
Expected: In the setting of asthma, the ETCO2 is likely going to be high due to air trapping, however, this waveform is concerning.
Waveform: This waveform consistent with Rebreathing.
Shape: The shape is relatively rectangular but Phase 0 never reaches the expected baseline of 0.
Trend: The trend is consistent with rebreathing in that the Phase 1 level keeps increasing.
Rate: The RR is 18 which is likely too fast for this patient.
This is a common occurrence in intubated asthmatics. The pathophysiology of asthma leads to multiple issues in ventilator management. One issue, exhibited here, is rebreathing–when the patient is not able to completely exhale before the ventilator triggers another breath. This can lead to significant airway trauma and critical eye is needed to prevent complications.
For an excellent review of ventilator management of an asthmatic in the ED check out this great post at Pediatric EM Morsels.
Case 5:
4 year old who was intubated using RSI for altered mental status. Following intubation, you see this on the monitor. Saturations 96%, ETCO2: 40 mmHg, RR of 20, and the ETCO2 turned into this about 2 minutes following intubation.
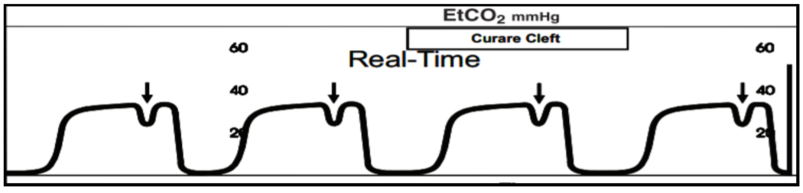
Number: The ETCO2 is normal at 40 mmHg.
Expected: In a patient with normal healthy lungs, I would expect a normal ETCO2. This is not the problem.
Waveform: This is a classic waveform known as the Curare cleft and consistent with the Muscle Relaxant Wearing Off After Intubation.
Shape: The shape is rectangular but there is a cleft during the end of the plateau.
Trend: The trend started following intubation, likely from inadequate sedation.
Rate: The rate is normal for this patient.
The cleft is due to the patient making some respiratory efforts as the muscle relaxant wears off. Interestingly, the depth of the cleft is inversely proportional to the degree of drug activity. The larger the cleft, the less drug activity.
In Part 2 of the ETCO2 post, we will take a deeper dive into the different indications where ETCO2 is commonly used and the different benefits and issues seen with monitoring in those cases.